# Yes, You Can Debug a Scala 3 Macro
Table of Contents
The State of Scala 3 Macro Docs
There is no good Scala 3 macro book. Most of what I know I picked up from forum threads, release notes or papers. This post is my attempt to collect everything I’ve figured out so far, plus the tips that aren’t written down anywhere else.
This post wouldn’t exist without my best friend Bartek, who has a knack for doing impossible things — mostly because nobody told him they were impossible.
Where to Learn From
Tutorials
I’d recommend starting with these four. They overlap in places, but each one introduces something the others skip:
- SoftwareMill — Scala 3 Macros: Tips and Tricks — the best starting point if you’ve never touched a macro before.
- Rock the JVM — A Comprehensive Guide to Scala 3 Macros — longest of the four, with worked examples.
- eed3si9n — Intro to Scala 3 Macros — concise, focused on the quote/splice mental model.
- Official Scala 3 Macros Guide and the Metaprogramming Reference — the official source.
Papers
Once the tutorials stop helping, the papers explain why the API looks the way it does. They’re less scary than they sound — skim the abstracts and intros first, and dip into the ones that match the question you’re currently stuck on:
- Scala 3 Macros: A Technical Report — the design rationale.
- Stojanov, Biboudis et al. — Inlining in Scala 3 — how
inlineactually works. - Stucki et al. — Multi-Stage Programming with Generative and Analytical Macros — the theoretical foundation for quotes and splices.
Quotes.scala Is Your Best Friend
You’ll spend more time in
Quotes.scala than in any tutorial.
Every tree type and every available method is defined there.
Each tree kind follows the same four-part shape: the type, the module object, a TypeTest for pattern matching, and
an extension methods trait. For example:
/** Tree representing an if/then/else `if (...) ... else ...` in the source code. */type If <: Term/** Module object of `type If`. */val If: IfModule
/** `TypeTest` that allows testing at runtime in a pattern match if a `Tree` is an `If`. */given IfTypeTest: TypeTest[Tree, If]
/** Makes extension methods on `If` available without any imports. */given IfMethods: IfMethods
/** Methods of the module object `val If`. */trait IfModule {  this: If.type =>  def apply(cond: Term, thenp: Term, elsep: Term): If  def copy(original: Tree)(cond: Term, thenp: Term, elsep: Term): If  def unapply(tree: If): (Term, Term, Term)}
/** Extension methods of `If`. */trait IfMethods:  extension (self: If)    def cond: Term    def thenp: Term    def elsep: Term    def isInline: Boolean
Once you spot the pattern, the rest of the reflection API stops being a guessing game. The Scaladoc itself is packed with hints about invariants, tree shapes and idiomatic usage — far more than the guides on the website.
When Quotes.scala runs out, the compiler source is the next stop. For example, I’ve learned how to synthesise an
anonymous class by reading
tpd.scala.
A Note on IDEs
For macro-heavy code, VS Code with Metals has been less painful than IntelliJ. Sometimes (really sometimes) navigation is better, error messages are clearer, and there are files that compile fine in Metals but IntelliJ refuses to recognise. Syntax highlighting breaks on nested quotes; the formatter mangles code around splices. I still use IntelliJ for everything else.
Measuring Where the Compiler Spends Time
Slow compiles and outright compiler hangs aren’t things you can diagnose with println. The built-in profiler shows
you exactly which phase and which expansion is eating the clock.
Enable it via compiler options:
-Yprofile-enabled-Yprofile-trace:<path to output file>This emits a trace in the Chrome/Perfetto format. Load it in ui.perfetto.dev and you get a flamegraph of phases, macro expansions, and type-check calls:
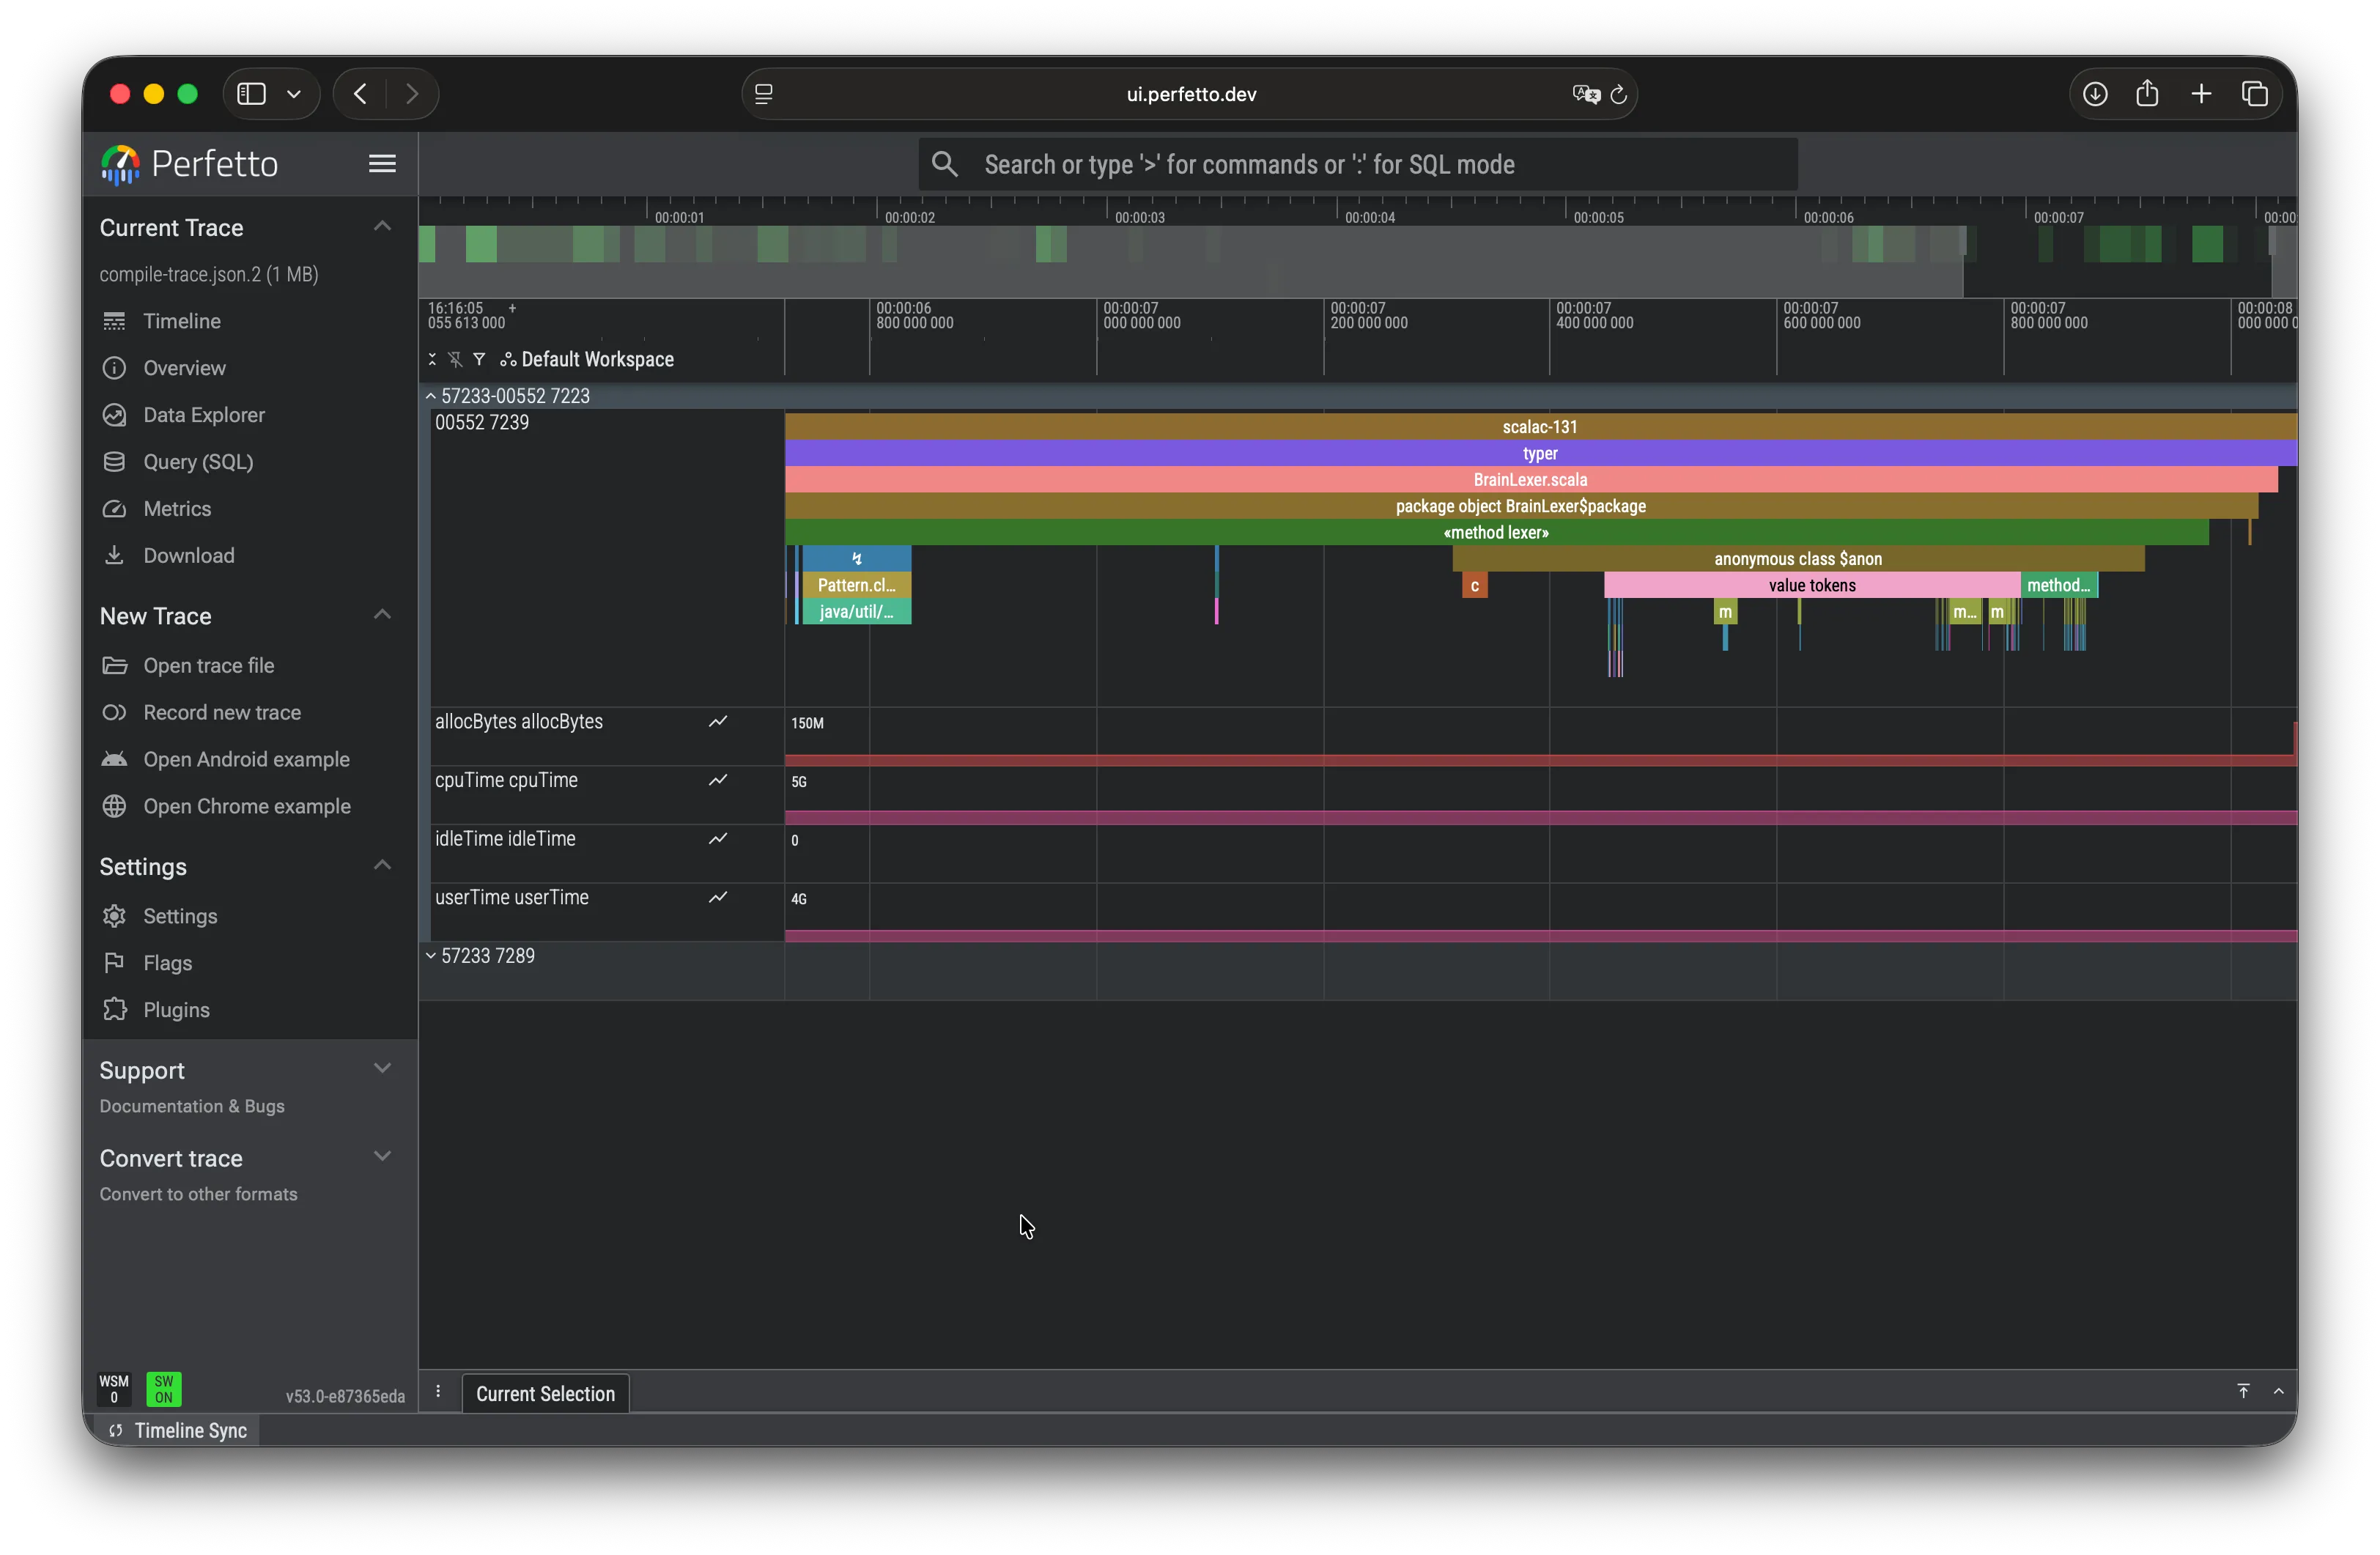
The option is documented exactly once, in a 3.6.3 release note — which is how you find most Scala tooling features, and yes, it’s as infuriating as it sounds.
Print Debugging, but Better
Everyone says println is the only way to debug a macro, so I built myself a pile of utilities on top of it. This
one dumps everything the compiler knows about a type into a single error message:
def dbg(using quotes: Quotes, printer: quotes.reflect.Printer[quotes.reflect.TypeRepr])(tpe: quotes.reflect.TypeRepr): Nothing = quotes.reflect.errorAndAbort( s""" |type: ${tpe.show} |widen: ${tpe.widen.show} |widenTermRefByName: ${tpe.widenTermRefByName.show} |widenByName: ${tpe.widenByName.show} |dealias: ${tpe.dealias.show} |dealiasKeepOpaques: ${tpe.dealiasKeepOpaques.show} |simplified: ${tpe.simplified.show} |classSymbol: ${tpe.classSymbol} |typeSymbol: ${tpe.typeSymbol} |termSymbol: ${tpe.termSymbol} |isSingleton: ${tpe.isSingleton} |baseClasses: ${tpe.baseClasses} |isFunctionType: ${tpe.isFunctionType} |isContextFunctionType: ${tpe.isContextFunctionType} |isErasedFunctionType: ${tpe.isErasedFunctionType} |isDependentFunctionType: ${tpe.isDependentFunctionType} |isTupleN: ${tpe.isTupleN} |typeArgs: ${tpe.typeArgs} |""".stripMargin, )Or this one, for when you’re guessing at an AST shape:
inline def showRawAst(inline body: Any) = ${ showRawAstImpl('{ body }) }
def showRawAstImpl(body: Expr[Any])(using quotes: Quotes) =  import quotes.reflect.*  report.errorAndAbort(Printer.TreeStructure.show(body.asTerm.underlyingArgument))
showRawAst(someExpression) aborts compilation with the raw Apply(Select(Ident(...), ...), ...) shape of the
expression. When you don’t know which quotes.reflect case to match on, it tells you.
Attaching a Real Debugger
My best friend, Bartek, didn’t get the memo that println was the only way to debug a macro.
He (and his LLM) treated the compiler as just another JVM process — attached a debugger, set breakpoints inside our macro implementations, and watched them fire on the next compile.
Written down like that it sounds obvious. Macros run during compilation, so the program to debug is the Scala
compiler. The compile-side recipe is always the same: start the compiler’s JVM with -agentlib:jdwp=..., whether
you run Mill, sbt or scala-cli. What changes is how you configure the IDE side.
Starting the Compile with JDWP
The flag:
-agentlib:jdwp=transport=dt_socket,server=y,suspend=y,address=5005suspend=y pauses the JVM until a debugger connects, so you can attach before anything expands. How to inject the
flag depends on the build tool:
mill
JAVA_OPTS="-agentlib:jdwp=transport=dt_socket,server=y,suspend=y,address=5005" mill -i YourModule.compilesbt
sbt -jvm-debug 5005scala-cli
# stop any running Bloop daemon (otherwise it'll reuse the old JVM without the agent)scala-cli --power bloop exit
# compile, passing JDWP args to the new Bloop JVMscala-cli compile . --bloop-java-opt "-agentlib:jdwp=transport=dt_socket,server=y,suspend=y,address=5005"
All three end up the same way: a Scala compiler sitting on port 5005, waiting.
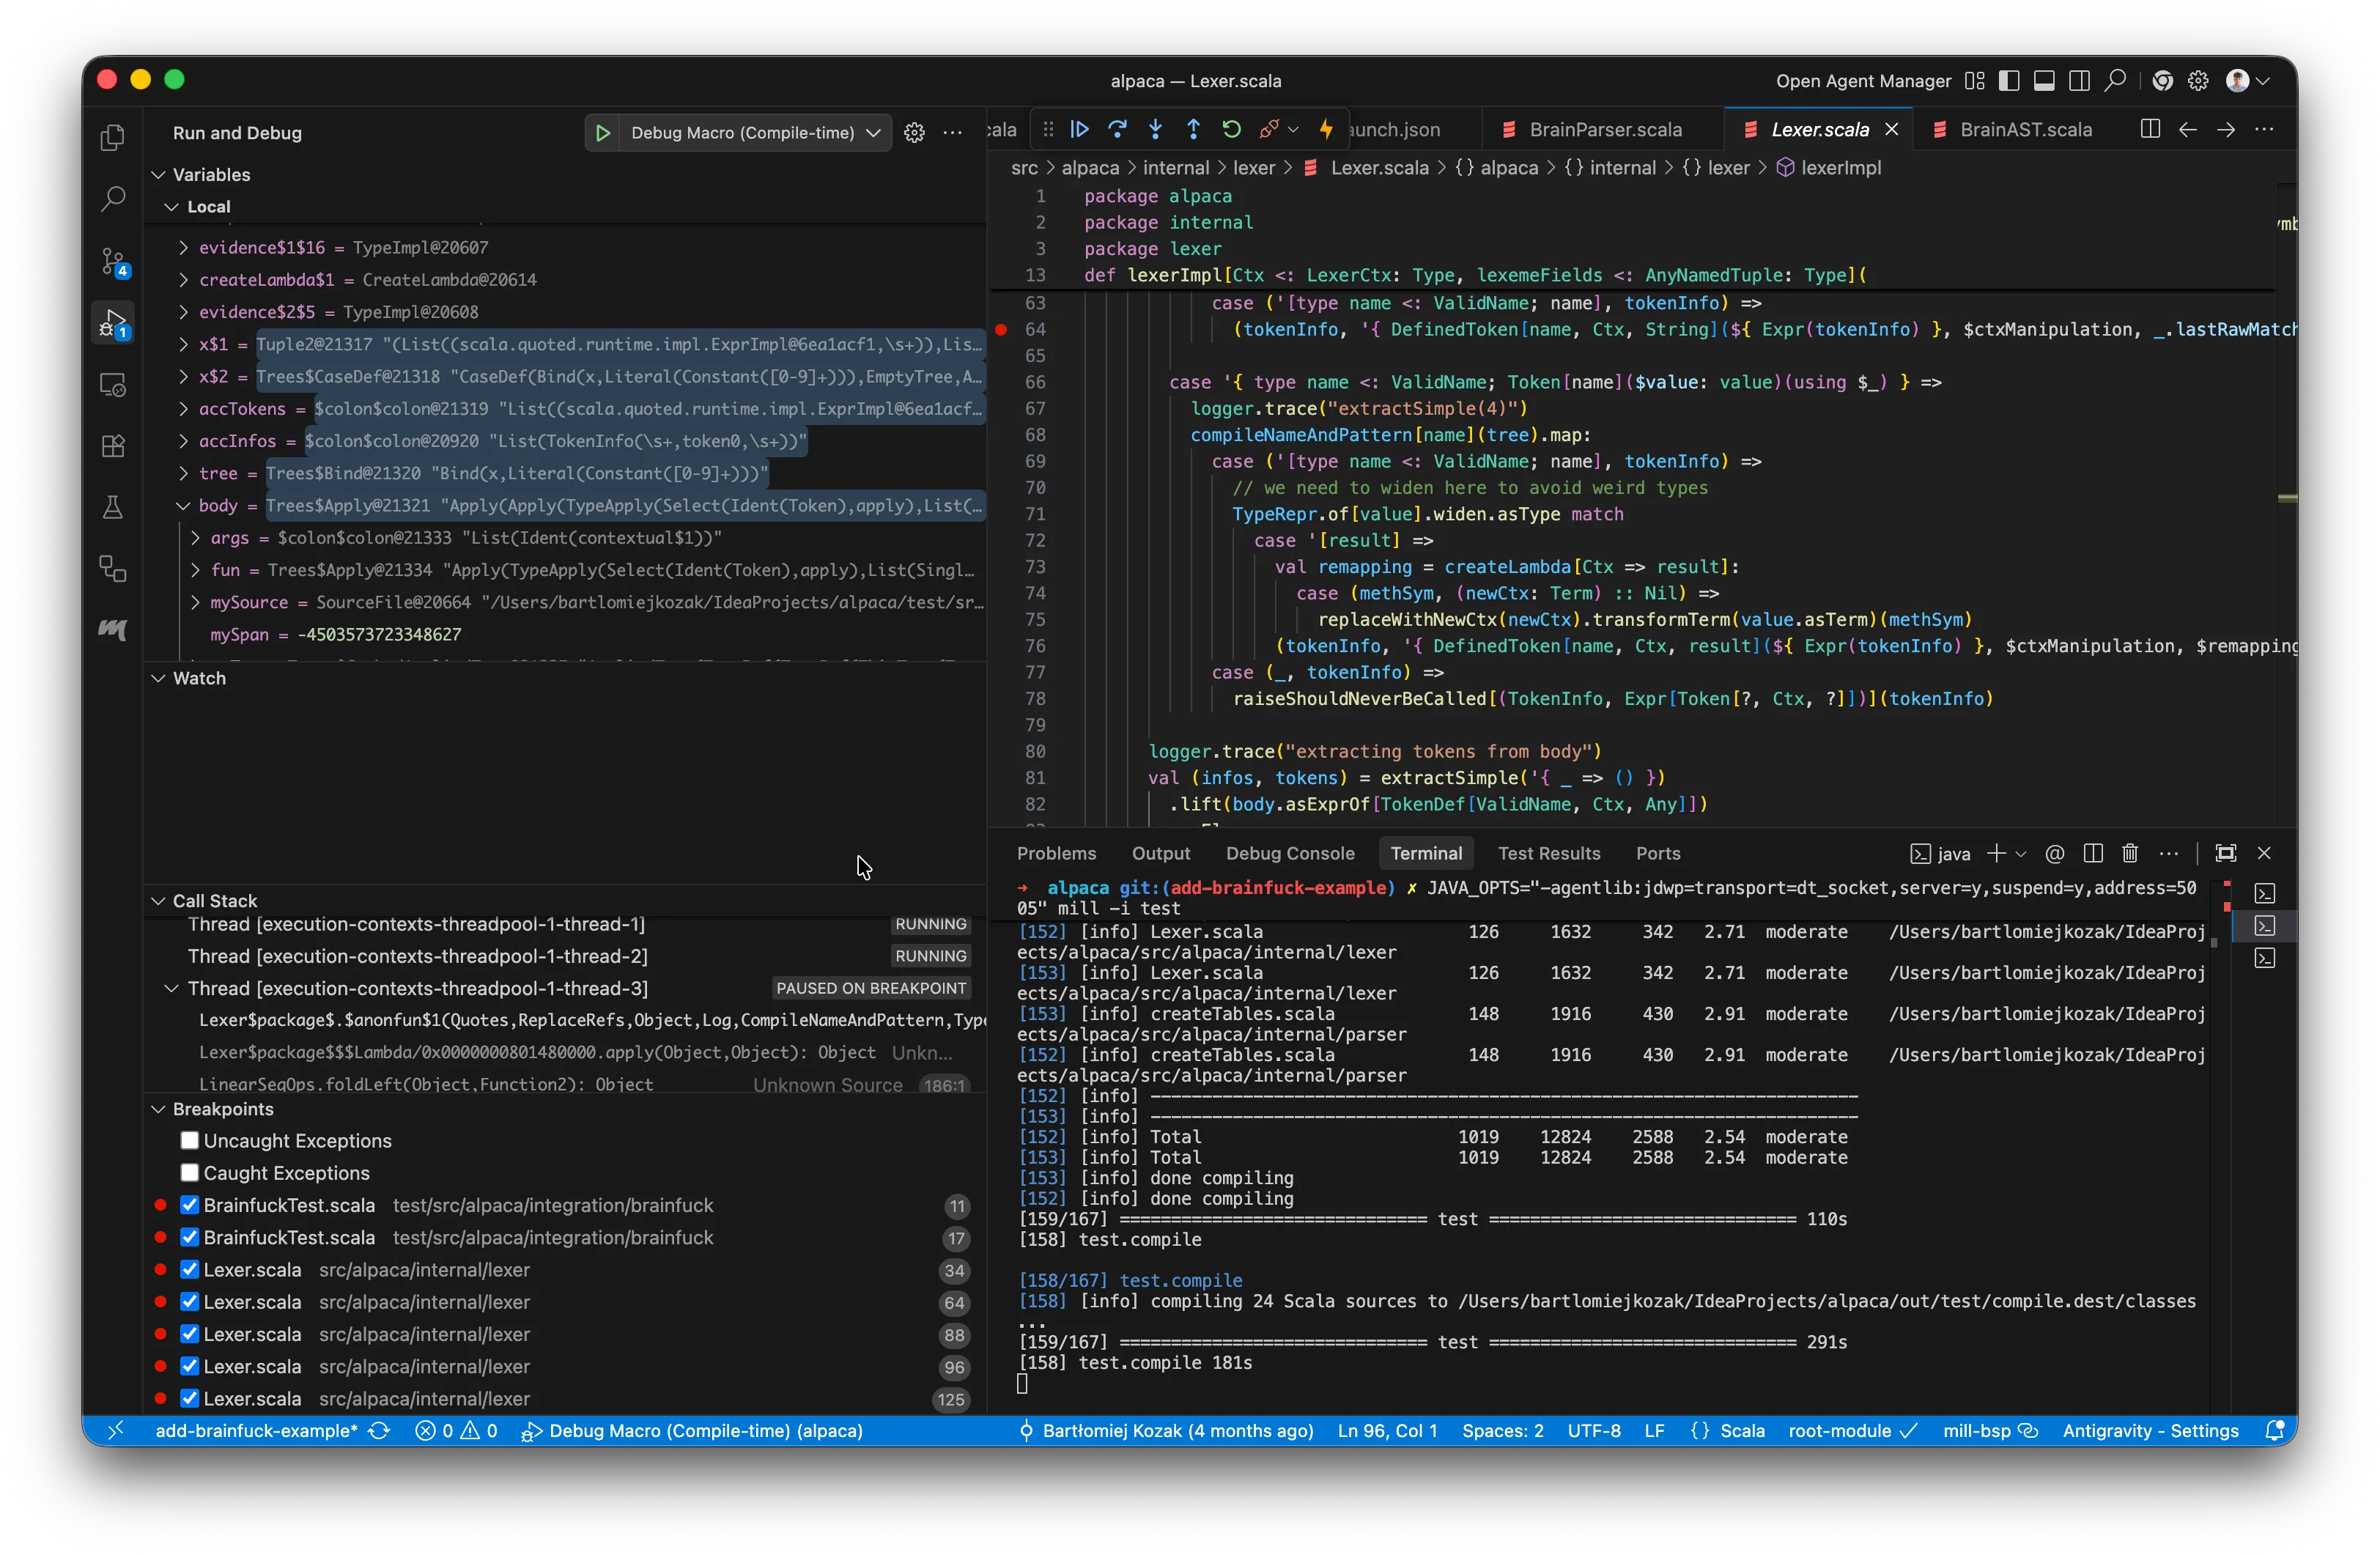
VS Code — launch.json
Add an attach configuration pointing at port 5005:
{ "version": "0.2.0", "configurations": [ { "type": "scala", "request": "attach", "name": "Debug Macro (Compile-time)", "hostName": "localhost", "port": 5005, "buildTarget": "YourModuleName" } ]}buildTarget is the BSP target for the module whose sources contain your breakpoints. Metals lists them in the
status bar; it’s usually the module name from your build file.
Set breakpoints, start to compile, then Run -> Start Debugging.
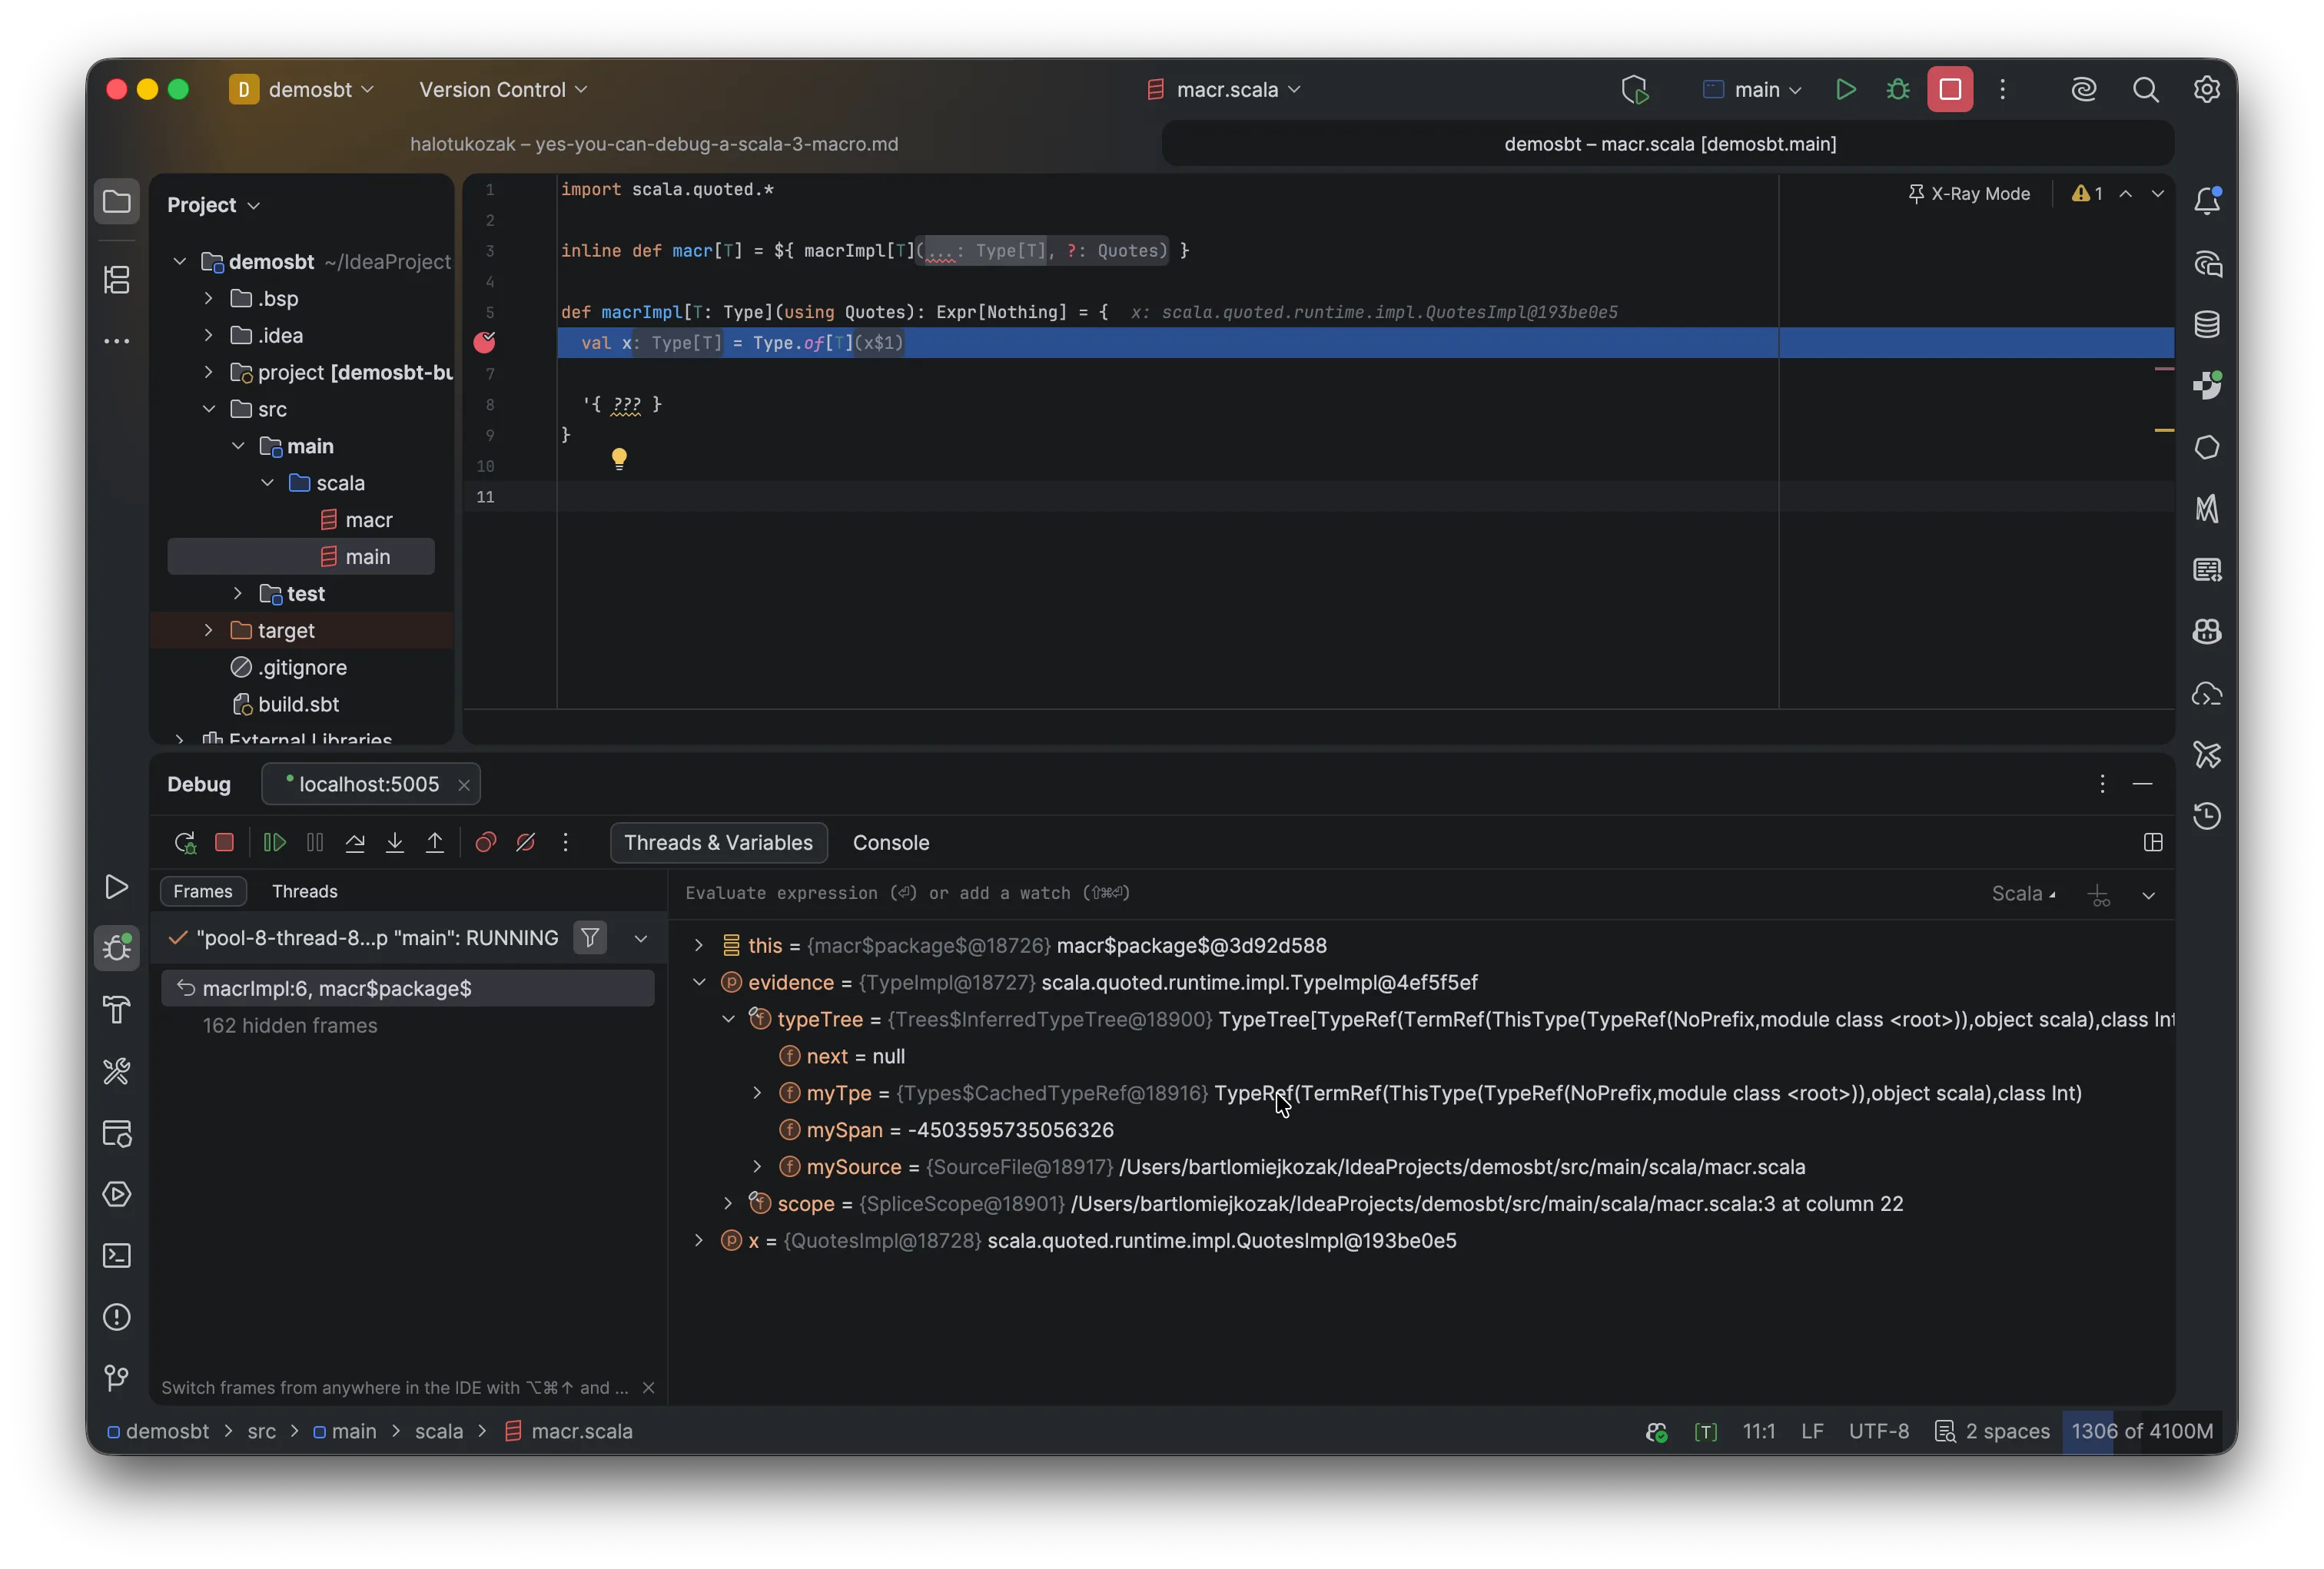
IntelliJ IDEA — Remote JVM Debug
IntelliJ has no BSP-aware attach config for macros, so use the generic remote debugger:
- Run -> Edit Configurations -> + -> Remote JVM Debug.
- Host
localhost, port5005, “Attach to remote JVM”, command line args for remote JVM auto-filled. - Start to compile.
- Run -> Debug -> your new configuration.
Case Closed
There is no official “how to debug a Scala 3 macro” page. Until there is, I hope this one saves someone time. See ya next time.
References
- SoftwareMill — Scala 3 Macros: Tips and Tricks
- Rock the JVM — A Comprehensive Guide to Scala 3 Macros
- eed3si9n — Intro to Scala 3 Macros
- Official Scala 3 Macros Guide
- Metaprogramming Reference
Quotes.scalasource- Perfetto Trace Viewer
- Scala 3.6.3 Release Notes — profiler
- scala-cli Debugging Cookbook
- Scala Debug Adapter Protocol